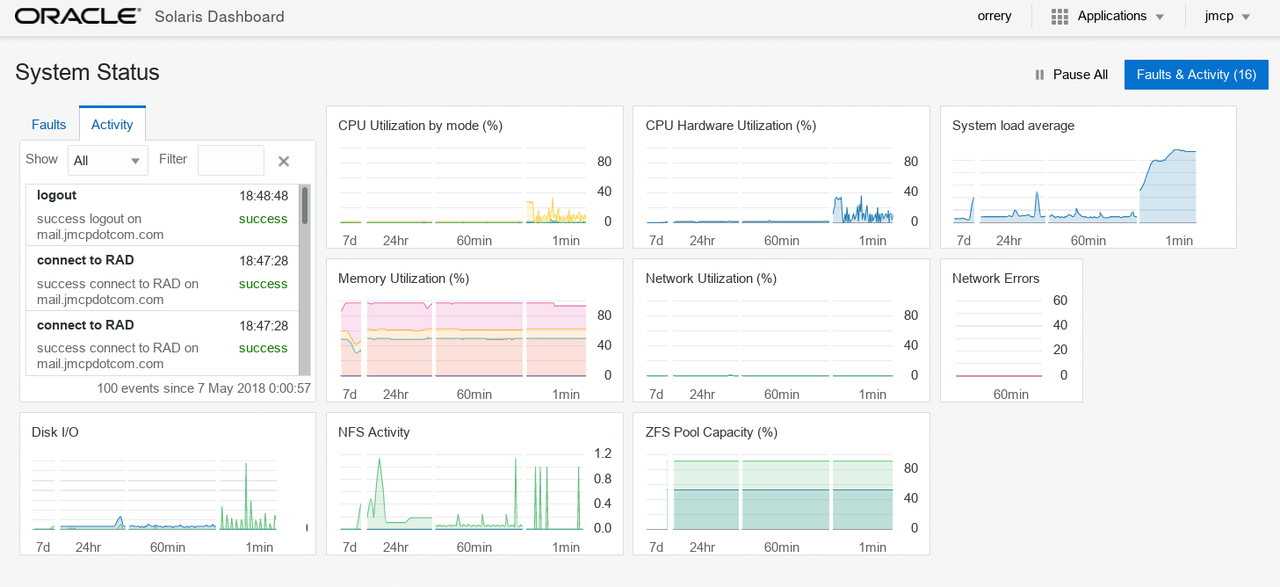
Having poked around with Solaris Analytics, and the WebUI a little, you might have wondered what information or statistics we gather by default. For instance, what are the statistics which we collect to make the Solaris Dashboard sheet useful?
The feature we provide to make this happen is the Collection. Collections give us a handy shorthand for gathering statistics. We ship with several collections:
# sstore list //:class.collection//:collection.name/*
IDENTIFIER
//:class.collection//:collection.name/root/apache-stats
//:class.collection//:collection.name/root/compliance-stat
//:class.collection//:collection.name/root/cpu-stats
//:class.collection//:collection.name/root/network-stats
//:class.collection//:collection.name/root/solaris-dashboard
//:class.collection//:collection.name/root/system
Listing collections is a privileged operation; if I run the command above as myself then I get a very different result:
$ sstore list //:class.collection//:collection.name/*
Warning (//:class.collection//:collection.name/*) - lookup error: no matching collections found
The collection which is enabled by default is //:class.collection//:collection.name/root/system, and you can see what it gathers by running sstore info on it:
# sstore info //:class.collection//:collection.name/root/system
Identifier: //:class.collection//:collection.name/root/system
  ssid: //:class.system//:*
 state: enabled
  uuid: 7a002985-2cf4-4965-adc9-b53116d8ae67
 owner: root
 cname: system
crtime: 1523243338963817
I quite like having the solaris-dashboard and apache-stats collections enabled, and that is really easy to do:
# sstoreadm enable-collection \
    //:class.collection//:collection.name/root/solaris-dashboard \
    //:class.collection//:collection.name/root/apache-stats
One thing I'm always concerned with, since our family media server is, shall we say, homebrew, is whether my disks are doing ok. Fortunately for me, it is very easy to cons up my own collection and stash it in /usr/lib/sstore/metadata/collections:
[
    {
        "$schema": "//:collection",
        "description": "disk-related statistics",
        "enabled": true,
        "id": "disk-stats",
        "ssids": [
            "//:class.disk//:res*//:*"
        ],
        "user": "root"
    }
]
and once you've restarted sstored you can see it like so:
# sstore info -a //:class.collection//:collection.name/root/disk-stats
Identifier: //:class.collection//:collection.name/root/disk-stats
   ssid: //:class.disk//:res*//:*
  state: enabled
   uuid: bee6c5c5-487e-4376-9d91-f4eb933fd64e
  owner: root
  cname: disk-stats
 crtime: 1525373259871426
[Note that you do need to ensure that your collection validates against the collections schema, so run soljsonvalidate /path/to/my/collection.json, and if you need to reformat it, soljsonfmt /path/to/my/collection.json].
So that's useful - now what? How about looking at the illegal requests counter? When you run iostat -En that information is jumbled up with all the other errors and can be a little difficult to distinguish:
$ iostat -En sd0
c2t0d0           Soft Errors: 0 Hard Errors: 0 Transport Errors: 0
Vendor: ATA      Product: WDC WD30EFRX-68E Revision: 0A82 Serial No: WD-WCC4N7CNYH0S
Size: 3000.59GB <3000592982016 bytes>
Media Error: 0 Device Not Ready: 0 No Device: 0 Recoverable: 0
Illegal Request: 537 Predictive Failure Analysis: 0 Non-Aligned Writes: 0
With Solaris Analytics, however, we can gather all of those errors together in aggregate and partition them at the same time. This command shows us the most recent data point (the -p -1 argument):
$ sstore export -p -1 "//:class.disk//:res.name/sd0//:stat.errors//:part.type"
TIME                VALUE IDENTIFIER
2018-05-08T19:07:44  //:class.disk//:res.name/sd0//:stat.errors//:part.type
                    device-not-ready: 0.0
                    hard-errors: 0.0
                    illegal-requests: 537.0
                    media-errors: 0.0
                    no-device: 0.0
                    non-aligned-writes: 0.0
                    predictive-failure-analysis: 0.0
                    recoverable: 0.0
                    soft-errors: 0.0
                    transport-errors: 0.0
That's a bit more useful! (Yes, having to use sdN rather than cXtYdZ is a pain, sorry). So... how about just looking for the illegal-requests? That's where we really make use of the partition concept - and let's throw the argument to give a daily total from the start of this month (May 2018):
$ sstore export -t 2018-05-01T00:00:00 -i 86400  "//:class.disk//:res.name/sd0//:stat.errors//:part.type(illegal-requests)"
TIME                VALUE IDENTIFIER
2018-05-01T00:00:00  //:class.disk//:res.name/sd0//:stat.errors//:part.type(illegal-requests)
                    illegal-requests: 27.0
2018-05-02T00:00:00  //:class.disk//:res.name/sd0//:stat.errors//:part.type(illegal-requests)
                    illegal-requests: 27.0
2018-05-03T00:00:00  //:class.disk//:res.name/sd0//:stat.errors//:part.type(illegal-requests)
                    illegal-requests: 27.0
2018-05-04T00:00:00  //:class.disk//:res.name/sd0//:stat.errors//:part.type(illegal-requests)
                    illegal-requests: 79.0
2018-05-05T00:00:00  //:class.disk//:res.name/sd0//:stat.errors//:part.type(illegal-requests)
                    illegal-requests: 174.0
2018-05-06T00:00:00  //:class.disk//:res.name/sd0//:stat.errors//:part.type(illegal-requests)
                    illegal-requests: 270.0
2018-05-07T00:00:00  //:class.disk//:res.name/sd0//:stat.errors//:part.type(illegal-requests)
                    illegal-requests: 365.02
2018-05-08T00:00:00  //:class.disk//:res.name/sd0//:stat.errors//:part.type(illegal-requests)
                    illegal-requests: 461.0
Much more useful - and observe that because we're using () to extract the partition element, we need to quote the argument so the shell doesn't get snippy with us.
To finish this post, let's take a look at two more really useful features,
slices and operators. One operator that I'm particularly happy with is
//:op.changed, which shows you when a statistic value changed. While not
particularly useful for volatile statistics on a per-second basis (watch
//:class.system//:stat.virtual-memory for a few minutes and you'll see what I
mean) if you aggregate such stats over a longer time period, such as a day,
you can get a better understanding what that stat is doing. So, with disk
errors again, but on a daily basis (-i 86400) from the start of this month
(-t 2018-05-01T00:00:00):
$ sstore export -t 2018-05-01T00:00:00 -i 86400  "//:class.disk//:res.name/sd0//:stat.errors//:op.changed"
TIME                VALUE IDENTIFIER
2018-05-01T00:00:00 27.0 //:class.disk//:res.name/sd0//:stat.errors//:op.changed
2018-05-04T00:00:00 79.0 //:class.disk//:res.name/sd0//:stat.errors//:op.changed
2018-05-05T00:00:00 174.0 //:class.disk//:res.name/sd0//:stat.errors//:op.changed
2018-05-06T00:00:00 270.0 //:class.disk//:res.name/sd0//:stat.errors//:op.changed
2018-05-07T00:00:00 365.0 //:class.disk//:res.name/sd0//:stat.errors//:op.changed
2018-05-08T00:00:00 461.0 //:class.disk//:res.name/sd0//:stat.errors//:op.changed
Finally, slices. These are //:s.[....] and you enter the statistic names
which you wish to extract inside the brackets - and once again I'm using the
//:op.changed to constrain the output:
$ sstore export -i 86400  //:class.disk//:res.name/sd//:s.[0,28]//:stat.errors//:op.changed //:class.disk//:res.name/sd//:s.[0,28]//:stat.//:s.[vendor,serial-number]//:op.changed
TIME                VALUE IDENTIFIER
1970-01-01T10:00:00 27.0 //:class.disk//:res.name/sd0//:stat.errors//:op.changed
2018-05-04T10:00:00 119.0 //:class.disk//:res.name/sd0//:stat.errors//:op.changed
2018-05-05T10:00:00 214.0 //:class.disk//:res.name/sd0//:stat.errors//:op.changed
2018-05-06T10:00:00 309.0 //:class.disk//:res.name/sd0//:stat.errors//:op.changed
2018-05-07T10:00:00 405.0 //:class.disk//:res.name/sd0//:stat.errors//:op.changed
2018-05-08T10:00:00 500.0 //:class.disk//:res.name/sd0//:stat.errors//:op.changed
1970-01-01T10:00:00 169.0 //:class.disk//:res.name/sd28//:stat.errors//:op.changed
2018-05-04T10:00:00 120.0 //:class.disk//:res.name/sd28//:stat.errors//:op.changed
2018-05-05T10:00:00 215.0 //:class.disk//:res.name/sd28//:stat.errors//:op.changed
2018-05-06T10:00:00 310.0 //:class.disk//:res.name/sd28//:stat.errors//:op.changed
2018-05-07T10:00:00 406.0 //:class.disk//:res.name/sd28//:stat.errors//:op.changed
2018-05-08T10:00:00 501.0 //:class.disk//:res.name/sd28//:stat.errors//:op.changed
1970-01-01T10:00:00 ATA      //:class.disk//:res.name/sd0//:stat.vendor//:op.changed
1970-01-01T10:00:00 Z1D5K89L //:class.disk//:res.name/sd0//:stat.serial-number//:op.changed
2018-05-04T10:00:00 WD-WCC4N7CNYH0S //:class.disk//:res.name/sd0//:stat.serial-number//:op.changed
1970-01-01T10:00:00 ATA      //:class.disk//:res.name/sd28//:stat.vendor//:op.changed
1970-01-01T10:00:00  //:class.disk//:res.name/sd28//:stat.serial-number//:op.changed
For more information about operators, slices and partitions, have a read of
ssid-op (aka ssid-op(7)).
Tune in next time when I'll guide you through the process of using a proper certificate for your WebUI instance, rather than the default self-signed certificate.