I'd like to share with you a way to build on the Solaris Analytics
components sstored and WebUI that I use with our PV inverter.
In April 2013 we had 15 solar panels installed on our roof, providing 3.9KW. This came with a JFY SunTwins 5000TL inverter, which has the useful feature of data monitoring via an RS232 serial port. The installers provided a cd with a 32bit Windows app which, while useful to start with, did not allow me to push the generation data up to a service like pvoutput.org.
Not being interested in leaving a laptop running Windows on during daylight hours, I searched for open source monitoring software, finding Jonathan Croucher's solarmonj via whirlpool. Importantly, I also found a programmer reference manual for the inverter, although it is poorly translated. I also discovered that there are a number of gaps between what it describes and what packet analysis and the windows app actually do.
I'm not too keen on C++, but it built fine on the raspberry pi that I had available to use, and ran well enough. With a bit of shell scripting around it I was able to upload to pvoutput.org and see how things were going.
Solarmonj has some attributes which I dislike: it's not (wasn't, at that time) a daemon, logfile generation isn't enterprise-y, it doesn't take command line arguments (so the device path is compiled in), doesn't handle multiple inverters from the same daemon, and doesn't let you send any arbitrary command listed in the spec document. It's single purpose - but performs that purpose well enough.
(Checking out Jonathan's github repo, I see that the version I was using did in fact get an update about 3 years ago, but I had the utility in "set and forget" mode, so never noticed).
I've written a new monitor which builds on Croucher's work, with these features: - written in Python, daemonises, is configurable, handles multiple inverters, updates pvoutput.org and sstored as well as writing to a local file.
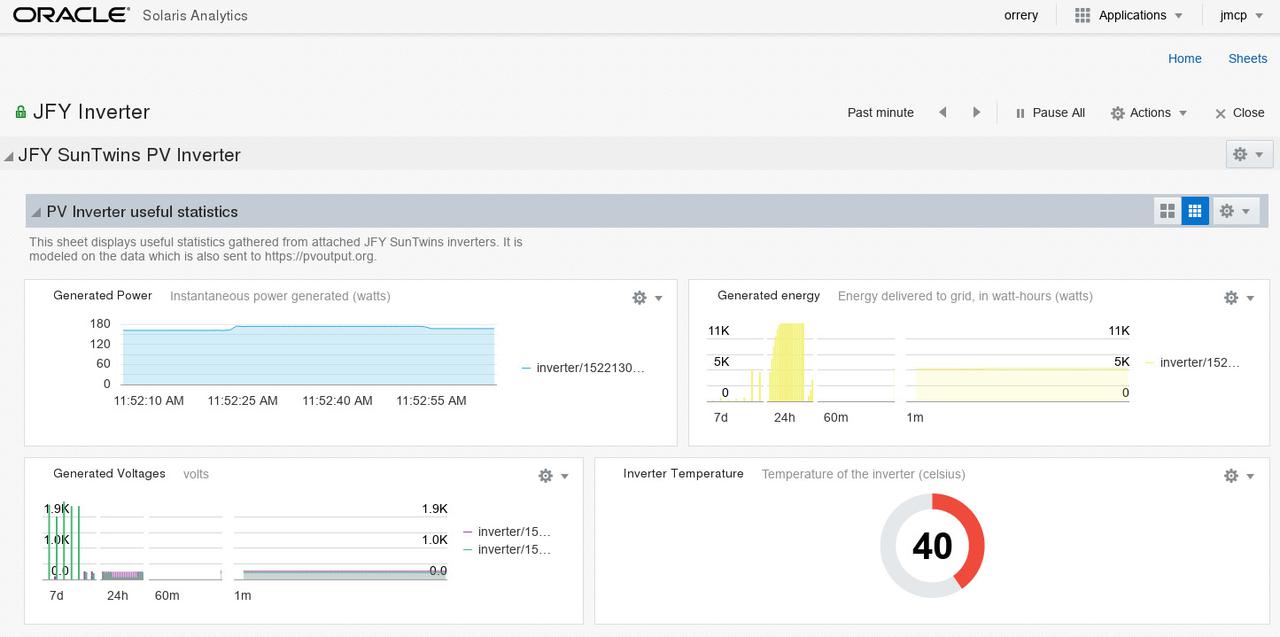
With this project I'm also providing sstored configuration files and a WebUI sheet:
Zerothly, you can get all the code for this project from my Github repo. It's still a work in progress but it's at the point of being sufficient for my needs so I'm happy to share it.
Since this post is about how to plug your app into Solaris Analytics, I won't delve too much into the SMF and IPS components of the code.
At the end of my previous post on the work blog I mentioned that I would discuss using the C and Python bindings for the Stats Store. This just post covers Python bindings, leaving detailed coverage of the C interface for another day.
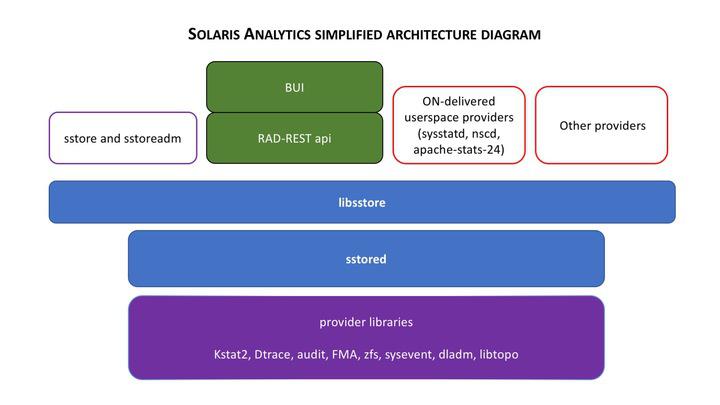
First of all, let's have a look at two basic architecture diagrams:
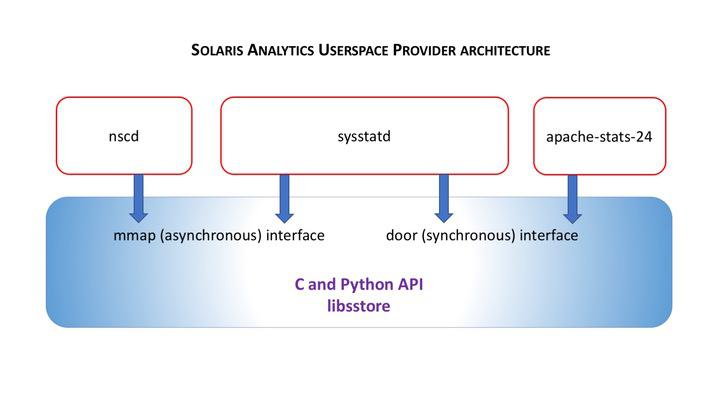
The C and Python bindings enable read-write access to sstored, so that you
can write your own provider. We call this a "userspace provider" because it
operates outside of the kernel of sstored.
For both bindings, we have three methods of putting data into sstored:
per-point synchronous (using a
door_call())per-point asynchronous (using a shared memory region)
bulk synchronous (using a
door_call())
The code that I've written for this utility is using the asynchronous method
which (at the bottom of the stack) depends on an mmap region which is shared
between the daemon and the client process. Since we do not have a real speed
constraint for updating sstored, I could have used the synchronous
method. I'll discuss the bulk synchronous method later.
To start with, my daemon needs a connection to sstored. Assuming that the
service is online, this is very simple:
from libsstore import SStore, SSException

sst = SStore()
(I've written the daemon so that each attached inverter has its own connection
to sstored, so sst is a thread instance variable).
The user that you run this code as must have these authorizations:
solaris.sstore.update.res
solaris.sstore.write
Add these to the user by uttering
# usermod -A +solaris.sstore.update.res,solaris.sstore.write $USER
Once you've got those authorizations sorted, you can add the appropriate resource to the class. I've chosen to name the resources with each inverter's serial number. My device's serial number is 1522130110183:
RESOURCE_SSID_PREFIX = "//:class.app/solar/jfy//:res.inverter/"
STATS = [
    "temperature",
    "power-generated",
    "voltage-dc",
    "current",
    "energy-generated",
    "voltage-ac"
    ]

# hr is Human-Readable, after we've processed the binary response
# from the inverter
hr_serial = 1522130110183
resname = RESOURCE_SSID_PREFIX + hr_serial

try:
    sst.resource_add(resname)
    self.print_warnings()
except SSException as exc:
    print("Unable to add resource {0} to sstored: {1}".format(
        resname, SSException.__str__))
    usesstore = False
    raise

stats = []
for sname in STATS:
        stats.append("{0}{1}//:stat.{2}".format(
            RESOURCE_SSID_PREFIX, hr_serial, sname))
try:
    stats_array = self.sst.data_attach(stats)
    print_warnings()
except SSException as exc:
    print("Unable to attach stats to sstored\n{0} / {1}".format(
        exc.message, exc.errno), file=sys.stderr)
    usesstore = False
    sst.free()
    sst = None
Each time we query the inverter, we get back binary data which needs decoding
and extracting. This is the "feature" of the documentation which annoys me
most: it doesn't match the data packet returned, so I had to go and click
through the inverter's front panel while watching retrieved values so I could
determine the field names and units. Ugh. Anyway, inside the thread's run()
method:
stats = query_normal_info()
if not stats:
    return
if usesstore:
    sstore_update(stats)
Now comes the magic:
def sstore_update(vals):
    """
    Updates the stats in sstored after stripping out the ignore[12]
    fields in JFYData. We're using the shared memory region method
    provided by data_attach(), so this is a very simple function.
    """

    values = {}
    for idx, fname in enumerate(JFYData):
        values[self.stats[idx]] = vals[fname] / JFYDivisors[idx]
    sst.data_update(values)
Then we go back to sleep for 30 seconds, and repeat.
An essential part of this project are the JSON metadata files that we
provide to the Stats Store. Without these, the daemon does not know
where the class, resources and statistics fit inside the namespace, nor
does it know what units or description to provide when we run sstore
info for any of these statistics.
All resources underneath a class must have the same statistics, and we
need to decide on the resource namespace prior to adding the class to
sstored. Here is the file class.app.solar.jfy.json, which in the
service/jfy package I deliver to /usr/lib/sstore/metadata/json/site:
{
    "$schema": "//:class",
    "copyright": "Copyright (c) 2018, James C. McPherson. All rights reserved.",
    "description": "JFY Solar Inverter monitor",
    "id": "app/solar/jfy",
    "namespaces": [
        {
            "name-type": "string",
            "resource-name": "inverter"
        }
    ],
    "stability": "stable",
    "stat-names": [
        "//:stat.temperature",
        "//:stat.power-generated",
        "//:stat.voltage-dc",
        "//:stat.current",
        "//:stat.voltage-ac",
        "//:stat.energy-generated"
    ]
}
This is validated by the daemon using the schemas shipped in
/usr/lib/sstore/metadata/json-schema, and comes with a companion file
stat.app.solar.jfy.json. On your
Solaris 11.4 system you can check these using the
soljsonvalidate utility. (Note that it's not currently possible to get
sstored to dynamically re-read metadata definitions, so a svcadm
restart sstore is required.
The last component that we have is the WebUI sheet, which I have
packaged so that it is delivered to
/usr/lib/webui/analytics/sheets/site.
This is accessible to you once you have logged in to your BUI instance and selected the Solaris Analytics app from the menu.
Prior to accessing that sheet, however, you need to configure the
service. On my system, the attached RS232 port is /dev/term/0, and I
have a PVOutput.org API Key and System ID:
# svccfg -s jfy
svc:/application/jfy> listprop config
config           application
config/debug     boolean     false
config/logpath   astring     /var/jfy/log/
config/usesstore boolean     true
svc:/application/jfy> listprop devterm0
devterm0                 inverter
devterm0/devname         astring     /dev/term/0
devterm0/pvoutput_apikey astring     elided
devterm0/pvoutput_sysid  count       elided
To create your system's configuration, simply add in the appropriate
definitions below. I suggest naming your inverter property group is a
way that you find useful; the constraint is that it be of the type inverter:
svc:/application/jfy> addpg devterm0 inverter
svc:/application/jfy> setprop devterm0/devname = astring: "/dev/term/0"
svc:/application/jfy> setprop devterm0/pvoutput_apikey = astring: "your api key goes here"
svc:/application/jfy> setprop devterm0/pvoutput_sysid = count: yourSysIDgoesHere
svc:/application/jfy> refresh
svc:/application/jfy> quit
# svcadm enable jfy
Since I'm running the service with debugging enabled, I can see copious details in the output from
$ tail -f `svcs -L jfy`
[ 2018 Apr  4 06:46:22 Executing start method ("/lib/svc/method/svc-jfy start"). ]
args: ['/usr/lib/jfy/jfymonitor.py', '-F', '/var/jfy/cfg', '-l', '/var/jfy/log', '-d']

response b'\xa5\xa5\x00\x000\xbf\x101522130110183   \xfa\xcb\n\r'
response b'\xa5\xa5\x02\x010\xbe\x01\x06\xfd\xbe\n\r'
Registration succeeded for device with serial number 1522130110183 on /dev/term/0
Inverter map:
id   1: application
id   2: 1522130110183
{u'devterm0': {u'devname': u'/dev/term/0', u'pvoutput_sysid': u'elided', u'pvoutput_apikey': u'elided'}}
[ 2018 Apr  4 06:46:44 Method "start" exited with status 0. ]
And there you have it - a brief example of how to use the Python
bindings for the Solaris Analytics feature.
If you have questions or comments about this post, please send me a message on Freenode, where I'm jmcp. Alternatively, add a comment to the github repo.