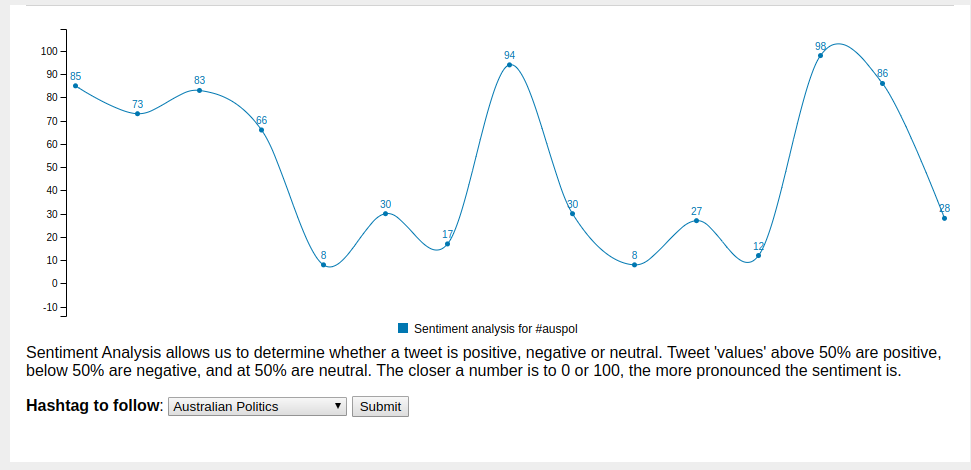
One principle that I work on is that I should always extend the fix (learnt via the Kepner-Tregoe Analytical Troubleshooting training many years ago). Following my investigation of how to provide a more accessible method of determining your electorate, I came back to the political polling ideas and got to thinking about how we can track the temperature of a conversation in, for example #auspol.
The term for this is sentiment analysis and while the major cloud providers have their own implementations of this (Microsoft Azure Text Analytics, AWS Comprehend, Google Cloud Natural Language API) you can also use Python's nltk in the comfort of your own venv. It's cheaper, too!
A bit of searching lead me to @Chapagain's post which was very useful and got me started - thankyou
I decided that I really want to do something more real-time, and while I could have done more scraping with Beautiful Soup, a quick look at the html that's returned with you run
import requests

url = "https://twitter.com/search?q=%23auspol&src=typed_query&f=live"
result = requests.get(url)
print(result.text)
is eye-wateringly complex. (Go on, try it!) I just couldn't be bothered with that so I signed up for a Twitter developer account and started looking at the APIs available for searching. These are easily used with the Twython library:
from twython import Twython

twitter = Tython(consumer_key, consumer_secret,
                 access_token, access_token_secret)
hashtag = "#auspol"
results = twitter.search(q=hashtag, result_type="recent")
for tweet in results["statuses"]:
    sentiment = classifier_func(tweet["text"])
    print(sentiment.prob("pos"))
I hit the rate limit a few times until I realiased that there was a while
true going on inside Twython when using the cursor method. In my
print-to-shell proof of concept, I got past that by using the search
function inside a while loop with a 30second sleep call. I knew that that
wasn't good enough for a web app, and would actually be a road block for doing
a properly updated graph-focused page.
For that I would need a charting library, and some JavaScript. I started out using Chart.js, but quickly realised that it didn't have any sort of flow, so then I retooled to use C3js instead.
The initial render of the template provides the first set of data, which is a
JavaScript array ([]), and checks for a saved hashtag and the id of the
most recently found tweet using Window.sessionStorage(). Then we set up a
function to get new data when called:
function getNewData() {
    var xhr = new XMLHttpRequest();
    xhr.open("GET", "/sentiment?hashtag="+hashtag+"&lastid="+lastid, true);
    xhr.onload = function (e) {
        if ((xhr.readyState === 4) && (xhr.status === 200)) {
            parsed = JSON.parse(xhr.responseText);
            sessionStorage.setItem("lastid", parsed["lastid"]);
            lastid = parsed["lastid"];
            labels = parsed["labels"];
            // Did we get new data points?
            if (parsed["chartdata"].length > 1) {
                // yes
                newDataCol = [ parsed["chartdata"] ];
                curidx += parsed["chartdata"].length - 1;
            } else {
                newDataCol = [];
            }
        }
    };
    xhr.onerror = function (e) {
        console.error(xhr.statusText);
    };
    xhr.send(null);
};
Finally, we need to tell the window to call our updateChart() function
every 30 seconds, and define that function:
function updateChart() {
    getNewData();
    if (newDataCol !== []) {
        chart.flow({
            columns: prevDataCol,
            done: function () {
               chart.flow({
                   columns: newDataCol,
                   line: { connectNull: true }
               })
            }
        });
        prevDataCol = newDataCol;
    }
};

/* Update the chart every 30 seconds */
window.setInterval(updateChart, 30000);
So that you can change the hashtag to watch, I added a small <form>
element which POSTs the new hashtag to the /sentiment method on submit and
then re-renders the template.

What I'm particularly happy with is that the JavaScript took me only a few hours last Saturday morning and was pretty straightforward to write.
You can find the code for this project in my GitHub repo au-pol-sentiment.