In a previous post I wrote about how I've started down the Data Science path, kicking off with an exploration of sentiment analysis for political tweets. This is a topic which I will come back to in the future, not least because the nltk corpus I've made use of for au-pol-sentiment is based on British political tweets. While Australia and Britain share a common political heritage, I'm not completely confident that our political discourse is quite covered by that corpus.
In the meantime, another aspect of Data Science in practice is the use of an ecosystem called Apache Spark. Leaving aside my 20+ years of muscle memory spelling it as SPARC, this is a Machine Learning engine, described on the homepage as a unified analytics engine for large-scale data processing.
My experience is that when I want or need to learn a new toolkit or utility, the best way to do so is by trying to directly solve a specific problem with it. One problem (ok, not really a problem, more a set of questions) I have is that with all of the data I've gathered since 2013 from my solar inverter I'm dependent on pvoutput.org for finding per-year and per-month averages, maxima and minima. So with a data science-focused job interview (with Oracle Labs) approaching, I decided to get stuck in and get started with Apache Spark.
The first issue I faced was implementing the ETL pipeline. I have two types of files to load - the first contains the output from solarmonj, the second has the output from my solar inverter script.
Here's the first schema form:
Field name |
Units |
|---|---|
Timestamp |
seconds-since-epoch |
Temperature |
float (degrees C) |
energyNow |
float (Watts) |
energyToday |
float (Watt-hours) |
powerGenerated |
float (Hertz) |
voltageDC |
float (Volts) |
current |
float (Amps) |
energyTotal |
float (Watt-hours) |
voltageAC |
float (Volts) |
The second schema is from jfy-monitor, and has this schema:
Field name |
Units |
|---|---|
Timestamp |
ISO8601-like ("yyyy-MM-dd'T'HH:mm:ss") |
Temperature |
float (degrees C) |
PowerGenerated |
float (Watts) |
VoltageDC |
float (Volts) |
Current |
float (Amps) |
EnergyGenerated |
float (Watts-Hours) |
VoltageAC |
float (Volts) |
There are two other salient pieces of information about these files. The first is that the energyTotal and EnergyGenerated fields are running totals of the amount of energy generated on that particular day. The second is that in the first version of the schema, energyTotal needs to be multiplied by 1000 to get the actual KW/h value.
With that knowledge ready, let's dive into the code.
The first step is to start up a Spark session:
from pyspark.sql.functions import date_format
from pyspark import SparkContext
from pyspark.sql import SparkSession

# Basic Spark session configuration
sc = SparkContext("local", "PV Inverter Analysis")
spark = SparkSession(sc)

# We don't need most of this output
log4j = sc._jvm.org.apache.log4j
log4j.LogManager.getRootLogger().setLevel(log4j.Level.ERROR)
I observed while prototyping this in the pyspark REPL environment that if I didn't turn the logging output right down, then I'd see squillions of INFO messages.
The second step is to generate a list of files. As you might have guessed, I've got a year/month/day hierarchy - but the older files have a csv extension. To get those files (and since I want to be able to process any given year or year+month combination), I need to use some globbing:
import glob

def generateFiles(topdir, year, month):
    """Construct per-year dicts of lists of files"""
    allfiles = {}
    kkey = ""
    patterns = []
    months = []
    # Since some of our data dirs have months as bare numbers and
    # others have a prepended 0, let's match them correctly.
    if month:
        if month < 10:
            months = [month, "0" + str(month)]
        else:
            months = [month]
    if year and month:
        patterns = ["{year}/{monthp}/**".format(year=year, monthp=monthp)
                    for monthp in months]
        kkey = year
    elif year:
        patterns = ["{year}/*/**".format(year=year)]
        kkey = year

    if patterns:
        globs = []
        for pat in patterns:
            globs.extend(glob.glob(os.path.join(topdir, pat)))
        allfiles[kkey] = globs
    else:
        for yy in allYears:
            allfiles[yy] = glob.glob(os.path.join(topdir,
                                                  "{yy}/*/*".format(yy=yy)))
    return allfiles
To load in each file, I turned to the tried-and-true Python standard module csv, and - rather than having a v1 and v2 processing function, I model DRY and use an input argument to determine which set of elements to match:
import csv
from datetime import datetime

def importCSV(fname, isOld):
    output = []
    if isOld:
        multiplier = 1000.0
    else:
        multiplier = 1.0

    csvreader = csv.reader(open(fname).readlines())
    for row in csvreader:
        try:
            if isOld:
                (tstamp, temp, _enow, _etoday, powergen, vdc,
                 current, energen, vac) = row
            else:
                (tstamp, temp, powergen, vdc, current, energen, vac) = row
        except ValueError as _ve:
            # print("failed at {row} of {fname}".format(row=row, fname=fname))
            continue

        if "e" in temp:
            # invalid line, skip it
            continue

        if isOld:
            isostamp = datetime.fromtimestamp(int(tstamp))
        else:
            isostamp = datetime.fromisoformat(tstamp)

        output.append({
            "timestamp": isostamp,
            "Temperature": float(temp),
            "PowerGenerated": float(powergen),
            "VoltageDC": float(vdc),
            "Current": float(current),
            "EnergyGenerated": float(energen) * multiplier,
            "VoltageAC": float(vac)})
    return output
Now we get to the Apache Spark part. Having got a dictionary of
anonymous dicts I can turn them into an Resilient Distributed
Dataset (RDD) and thence a DataFrame. I chose the DataFrame
model rather than a Row because that matches up nicely with my
existing data format. For other applications (such as when I extend my
Twitter Sentiment Analysis project with the streaming API) I'll use
the Row datatype instead.
def now():
    """ Returns an ISO8601-formatted (without microseconds) timestamp"""
    return datetime.now().strftime("%Y-%M-%dT%H:%m:%S")

allFiles = generateFiles("data", qyear, qmonth)

print(now(), "Importing data files")

for k in allFiles:
    rddyear = []
    for fn in allFiles[k]:
        if fn.endswith(".csv"):
            rddyear.extend(importCSV(fn, True))
        else:
            rddyear.extend(importCSV(fn, False))
    rdds[k] = rddyear

print(now(), "All data files imported")

for year in allYears:
    rdd = sc.parallelize(rdds[year])
    allFrames[year] = rdd.toDF()
    newFrame = "new" + str(year)
    # Extend the schema for our convenience
    allFrames[newFrame] = allFrames[year].withColumn(
        "DateOnly", date_format('timestamp', "yyyyMMdd")
    ).withColumn("TimeOnly", date_format('timestamp', "HHmmss"))
    allFrames[newFrame].createOrReplaceTempView("view{year}".format(
        year=year))

print(now(), "Data transformed from RDDs into DataFrames")
The reason I chose to extend the frames with two extra columns is
because when I search for the record dates (minimum and maximum), I want
to have a quick SELECT which I can aggregate on.
ymdquery = "SELECT DISTINCT DateOnly from {view} WHERE DateOnly "
ymdquery += "LIKE '{yyyymm}%' ORDER BY DateOnly ASC"

for year in allYears:
    for mon in allMonths:
        if mon < 10:
            yyyymm = str(year) + "0" + str(mon)
        else:
            yyyymm = str(year) + str(mon)

        _dates = spark.sql(ymdquery.format(
            view=view, yyyymm=yyyymm)).collect()
        days = [n.asDict()["DateOnly"] for n in _dates]

        _monthMax = frame.filter(
            frame.DateOnly.isin(days)).agg(
                {"EnergyGenerated": "max"}).collect()[0]
        monthMax = _monthMax.asDict()["max(EnergyGenerated)"]
I keep track of each day's maximum, and update my minval and
minDay as required. All this information is then stored in a
per-month dict, and then in a per-year dict.
The last stage is to print out the record dates, monthly and yearly totals, averages and other values.
Running this utility on my 4-core Ubuntu system at home, I get what I believe are ok timings for whole-year investigations, and reasonable timings if I check a specific month.
When I run the utility for January 2018, the output looks like this:
(v-3.7-linux) flerken:solar-spark $ SPARK_LOCAL_IP=0.0.0.0 time -f "%E"  spark-submit --executor-memory 2G --driver-memory 2G solar-spark.py  -y 2018 -m 1
19/10/15 12:23:57 WARN NativeCodeLoader: Unable to load native-hadoop library for your platform... using builtin-java classes where applicable
Using Spark default log4j profile: org/apache/spark/log4j-defaults.properties

[Most INFO-level output elided]

19/10/15 12:23:58 INFO Utils: Successfully started service 'SparkUI' on port 4040.
19/10/15 12:23:58 INFO SparkUI: Bound SparkUI to 0.0.0.0, and started at http://0.0.0.0:4040

2019-23-15T12:10:59 Importing data files
2019-23-15T12:10:59 All data files imported
/space/jmcp/web/v-3.7-linux/lib/python3.7/site-packages/pyspark/python/lib/pyspark.zip/pyspark/sql/session.py:366: UserWarning: Using RDD of dict to inferSchema is deprecated. Use pyspark.sql.Row instead
2019-24-15T12:10:01 Data transformed from RDDs into DataFrames
2019-24-15T12:10:01 Analysing 2018
2019-24-15T12:10:01          January
2019-24-15T12:10:15 All data analysed
2019-24-15T12:10:15 2018 total generation: 436130.00 KW/h
2019-24-15T12:10:15         January total:               436130.00 KW/h
2019-24-15T12:10:15         Record dates for January:    Max on 20180131 (16780.00 KW/h), Min on 20180102 (10560.00 KW/h)
2019-24-15T12:10:15         Average daily generation  14068.71 KW/h
2019-24-15T12:10:15 ----------------

0:18.76
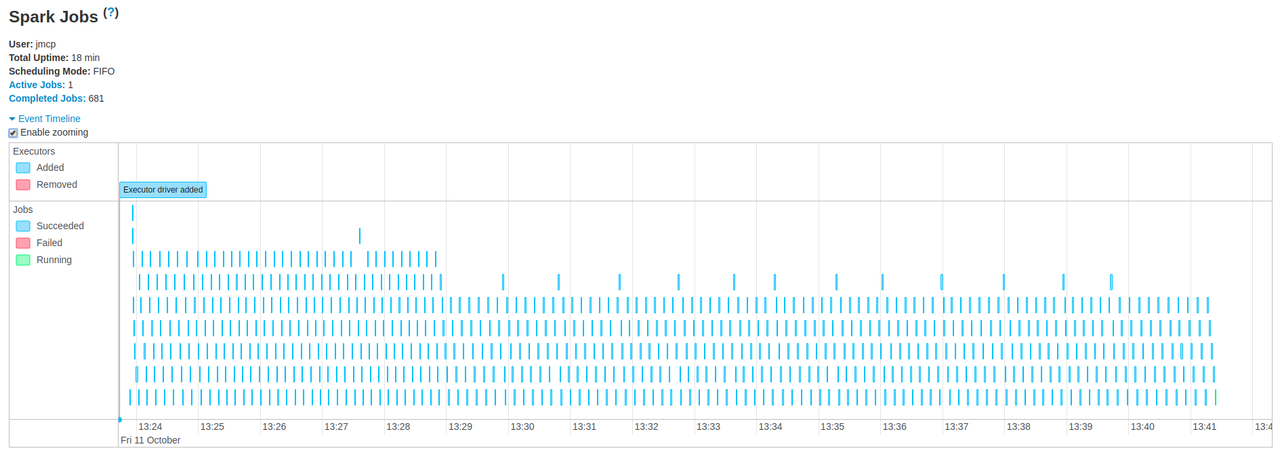
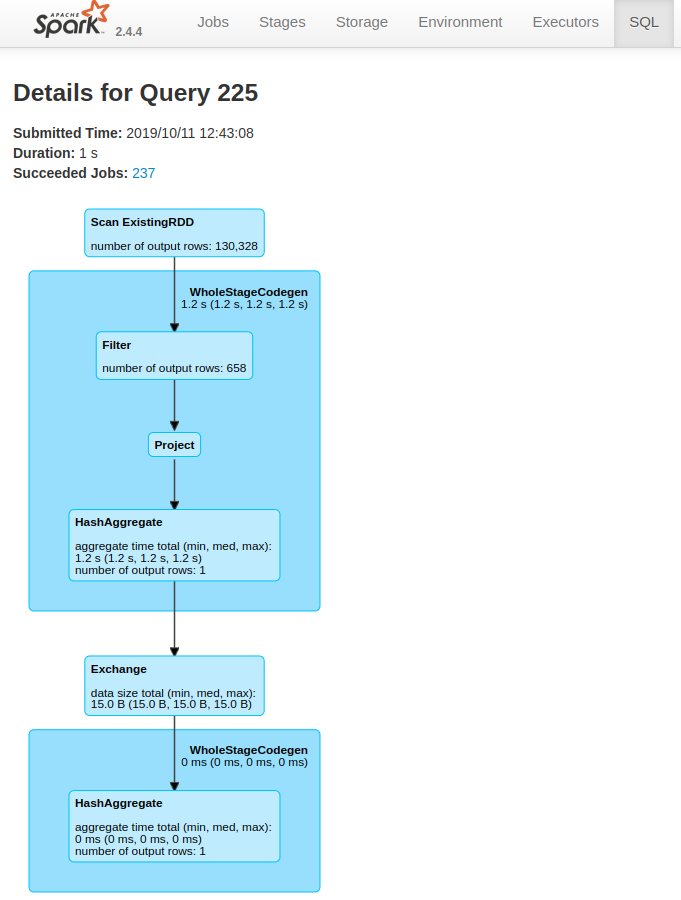
While that processing is going on, you can see a dashboard with useful
information about the application at http://localhost:4040:


You can find the code for this project in my GitHub repo solar-spark.