Posts for year 2019

init(Apache Spark)

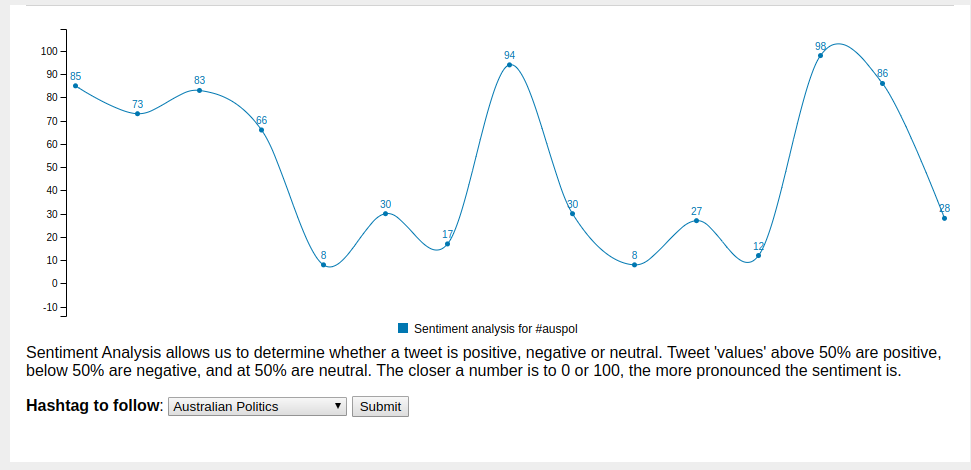
In a previous post I wrote about how I've started down the Data Science path, kicking off with an exploration of sentiment analysis for political tweets. This is a topic which I will come back to in the future, not least because the nltk corpus I've made use of for au-pol-sentiment is based on British political tweets. While Australia and Britain share a common political heritage, I'm not completely confident that our political discourse is quite covered by that corpus.

In the meantime, another aspect of Data Science in practice is the use of an ecosystem called Apache Spark. Leaving aside my 20+ years of muscle memory spelling it as SPARC, this is a Machine Learning engine, described on the homepage as a unified analytics engine for large-scale data processing.

My experience is that when I want or need to learn a new toolkit or utility, the best way to do so is by trying to directly solve a specific problem with it. One problem (ok, not really a problem, more a set of questions) I have is that with all of the data I've gathered since 2013 from my solar inverter I'm dependent on pvoutput.org for finding per-year and per-month averages, maxima and minima. So with a data science-focused job interview (with Oracle Labs) approaching, I decided to get stuck in and get started with Apache Spark.

The first issue I faced was implementing the ETL pipeline. I have two types of files to load - the first contains the output from solarmonj, the second has the output from my solar inverter script.

Here's the first schema form:

Field name

Units

Timestamp

seconds-since-epoch

Temperature

float (degrees C)

energyNow

float (Watts)

energyToday

float (Watt-hours)

powerGenerated

float (Hertz)

voltageDC

float (Volts)

current

float (Amps)

energyTotal

float (Watt-hours)

voltageAC

float (Volts)


The second schema is from jfy-monitor, and has this schema:

Field name

Units

Timestamp

ISO8601-like ("yyyy-MM-dd'T'HH:mm:ss")

Temperature

float (degrees C)

PowerGenerated

float (Watts)

VoltageDC

float (Volts)

Current

float (Amps)

EnergyGenerated

float (Watts-Hours)

VoltageAC

float (Volts)

There are two other salient pieces of information about these files. The first is that the energyTotal and EnergyGenerated fields are running totals of the amount of energy generated on that particular day. The second is that in the first version of the schema, energyTotal needs to be multiplied by 1000 to get the actual KW/h value.

With that knowledge ready, let's dive into the code.

The first step is to start up a Spark session:

from pyspark.sql.functions import date_format
from pyspark import SparkContext
from pyspark.sql import SparkSession

# Basic Spark session configuration
sc = SparkContext("local", "PV Inverter Analysis")
spark = SparkSession(sc)

# We don't need most of this output
log4j = sc._jvm.org.apache.log4j
log4j.LogManager.getRootLogger().setLevel(log4j.Level.ERROR)

I observed while prototyping this in the pyspark REPL environment that if I didn't turn the logging output right down, then I'd see squillions of INFO messages.

The second step is to generate a list of files. As you might have guessed, I've got a year/month/day hierarchy - but the older files have a csv extension. To get those files (and since I want to be able to process any given year or year+month combination), I need to use some globbing:

import glob

def generateFiles(topdir, year, month):
    """Construct per-year dicts of lists of files"""
    allfiles = {}
    kkey = ""
    patterns = []
    months = []
    # Since some of our data dirs have months as bare numbers and
    # others have a prepended 0, let's match them correctly.
    if month:
        if month < 10:
            months = [month, "0" + str(month)]
        else:
            months = [month]
    if year and month:
        patterns = ["{year}/{monthp}/**".format(year=year, monthp=monthp)
                    for monthp in months]
        kkey = year
    elif year:
        patterns = ["{year}/*/**".format(year=year)]
        kkey = year

    if patterns:
        globs = []
        for pat in patterns:
            globs.extend(glob.glob(os.path.join(topdir, pat)))
        allfiles[kkey] = globs
    else:
        for yy in allYears:
            allfiles[yy] = glob.glob(os.path.join(topdir,
                                                  "{yy}/*/*".format(yy=yy)))
    return allfiles

To load in each file, I turned to the tried-and-true Python standard module csv, and - rather than having a v1 and v2 processing function, I model DRY and use an input argument to determine which set of elements to match:

import csv
from datetime import datetime

def importCSV(fname, isOld):
    output = []
    if isOld:
        multiplier = 1000.0
    else:
        multiplier = 1.0

    csvreader = csv.reader(open(fname).readlines())
    for row in csvreader:
        try:
            if isOld:
                (tstamp, temp, _enow, _etoday, powergen, vdc,
                 current, energen, vac) = row
            else:
                (tstamp, temp, powergen, vdc, current, energen, vac) = row
        except ValueError as _ve:
            # print("failed at {row} of {fname}".format(row=row, fname=fname))
            continue

        if "e" in temp:
            # invalid line, skip it
            continue

        if isOld:
            isostamp = datetime.fromtimestamp(int(tstamp))
        else:
            isostamp = datetime.fromisoformat(tstamp)

        output.append({
            "timestamp": isostamp,
            "Temperature": float(temp),
            "PowerGenerated": float(powergen),
            "VoltageDC": float(vdc),
            "Current": float(current),
            "EnergyGenerated": float(energen) * multiplier,
            "VoltageAC": float(vac)})
    return output

Now we get to the Apache Spark part. Having got a dictionary of anonymous dicts I can turn them into an Resilient Distributed Dataset (RDD) and thence a DataFrame. I chose the DataFrame model rather than a Row because that matches up nicely with my existing data format. For other applications (such as when I extend my Twitter Sentiment Analysis project with the streaming API) I'll use the Row datatype instead.

def now():
    """ Returns an ISO8601-formatted (without microseconds) timestamp"""
    return datetime.now().strftime("%Y-%M-%dT%H:%m:%S")

allFiles = generateFiles("data", qyear, qmonth)

print(now(), "Importing data files")

for k in allFiles:
    rddyear = []
    for fn in allFiles[k]:
        if fn.endswith(".csv"):
            rddyear.extend(importCSV(fn, True))
        else:
            rddyear.extend(importCSV(fn, False))
    rdds[k] = rddyear

print(now(), "All data files imported")

for year in allYears:
    rdd = sc.parallelize(rdds[year])
    allFrames[year] = rdd.toDF()
    newFrame = "new" + str(year)
    # Extend the schema for our convenience
    allFrames[newFrame] = allFrames[year].withColumn(
        "DateOnly", date_format('timestamp', "yyyyMMdd")
    ).withColumn("TimeOnly", date_format('timestamp', "HHmmss"))
    allFrames[newFrame].createOrReplaceTempView("view{year}".format(
        year=year))

print(now(), "Data transformed from RDDs into DataFrames")

The reason I chose to extend the frames with two extra columns is because when I search for the record dates (minimum and maximum), I want to have a quick SELECT which I can aggregate on.

ymdquery = "SELECT DISTINCT DateOnly from {view} WHERE DateOnly "
ymdquery += "LIKE '{yyyymm}%' ORDER BY DateOnly ASC"

for year in allYears:
    for mon in allMonths:
        if mon < 10:
            yyyymm = str(year) + "0" + str(mon)
        else:
            yyyymm = str(year) + str(mon)

        _dates = spark.sql(ymdquery.format(
            view=view, yyyymm=yyyymm)).collect()
        days = [n.asDict()["DateOnly"] for n in _dates]

        _monthMax = frame.filter(
            frame.DateOnly.isin(days)).agg(
                {"EnergyGenerated": "max"}).collect()[0]
        monthMax = _monthMax.asDict()["max(EnergyGenerated)"]

I keep track of each day's maximum, and update my minval and minDay as required. All this information is then stored in a per-month dict, and then in a per-year dict.

The last stage is to print out the record dates, monthly and yearly totals, averages and other values.

Running this utility on my 4-core Ubuntu system at home, I get what I believe are ok timings for whole-year investigations, and reasonable timings if I check a specific month.

When I run the utility for January 2018, the output looks like this:

(v-3.7-linux) flerken:solar-spark $ SPARK_LOCAL_IP=0.0.0.0 time -f "%E"  spark-submit --executor-memory 2G --driver-memory 2G solar-spark.py  -y 2018 -m 1
19/10/15 12:23:57 WARN NativeCodeLoader: Unable to load native-hadoop library for your platform... using builtin-java classes where applicable
Using Spark default log4j profile: org/apache/spark/log4j-defaults.properties

[Most INFO-level output elided]

19/10/15 12:23:58 INFO Utils: Successfully started service 'SparkUI' on port 4040.
19/10/15 12:23:58 INFO SparkUI: Bound SparkUI to 0.0.0.0, and started at http://0.0.0.0:4040

2019-23-15T12:10:59 Importing data files
2019-23-15T12:10:59 All data files imported
/space/jmcp/web/v-3.7-linux/lib/python3.7/site-packages/pyspark/python/lib/pyspark.zip/pyspark/sql/session.py:366: UserWarning: Using RDD of dict to inferSchema is deprecated. Use pyspark.sql.Row instead
2019-24-15T12:10:01 Data transformed from RDDs into DataFrames
2019-24-15T12:10:01 Analysing 2018
2019-24-15T12:10:01          January
2019-24-15T12:10:15 All data analysed
2019-24-15T12:10:15 2018 total generation: 436130.00 KW/h
2019-24-15T12:10:15         January total:               436130.00 KW/h
2019-24-15T12:10:15         Record dates for January:    Max on 20180131 (16780.00 KW/h), Min on 20180102 (10560.00 KW/h)
2019-24-15T12:10:15         Average daily generation  14068.71 KW/h
2019-24-15T12:10:15 ----------------

0:18.76

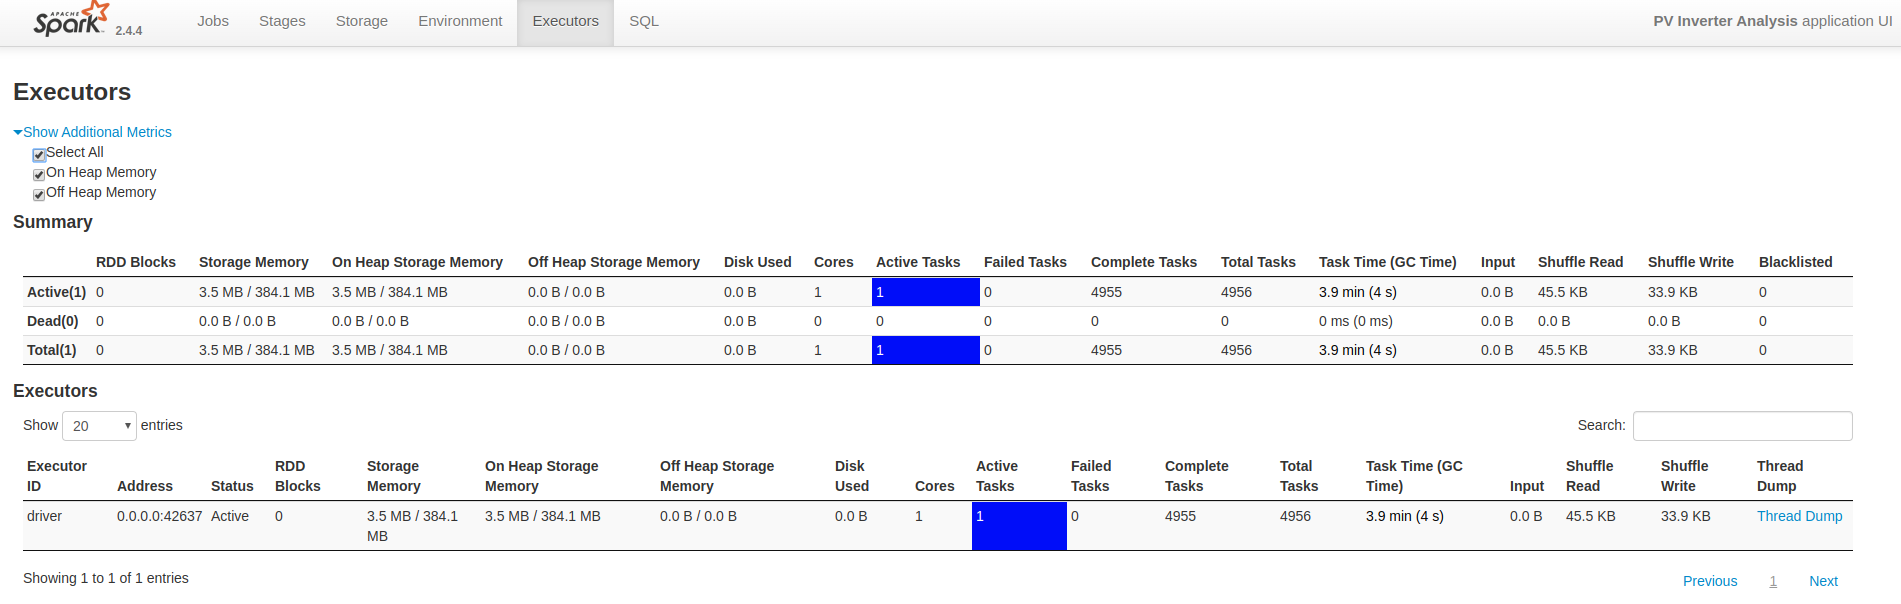
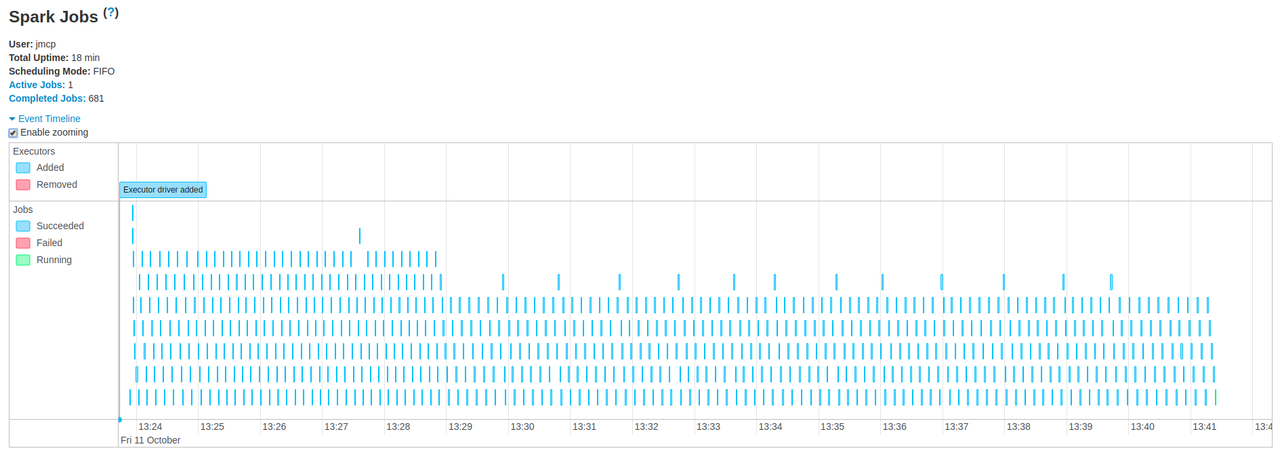
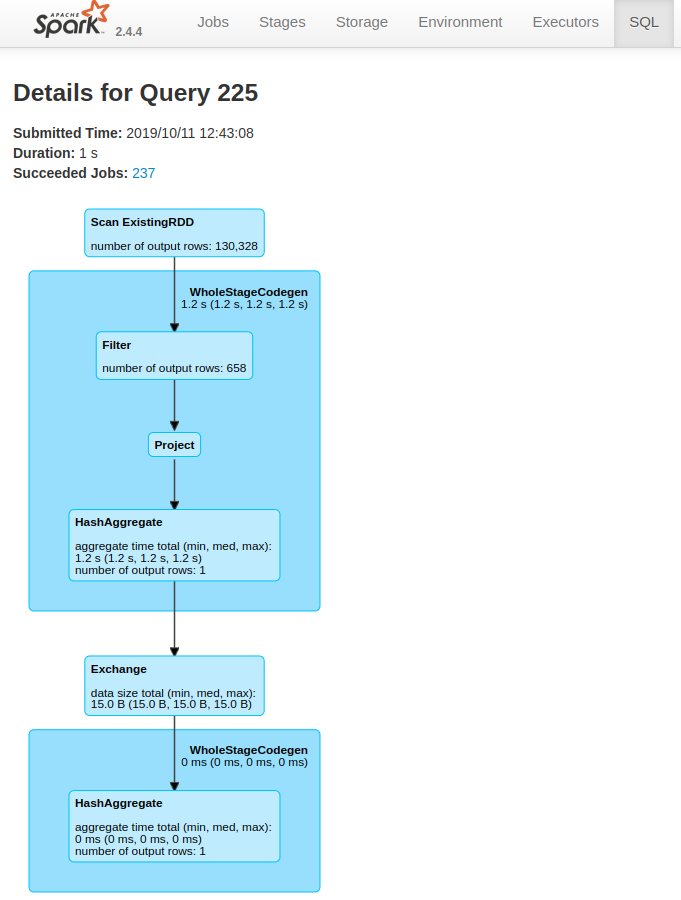
While that processing is going on, you can see a dashboard with useful information about the application at http://localhost:4040:

ExecutorsJobsDetails of a query

You can find the code for this project in my GitHub repo solar-spark.


Microservices (part 2)

One principle that I work on is that I should always extend the fix (learnt via the Kepner-Tregoe Analytical Troubleshooting training many years ago). Following my investigation of how to provide a more accessible method of determining your electorate, I came back to the political polling ideas and got to thinking about how we can track the temperature of a conversation in, for example #auspol.

The term for this is sentiment analysis and while the major cloud providers have their own implementations of this (Microsoft Azure Text Analytics, AWS Comprehend, Google Cloud Natural Language API) you can also use Python's nltk in the comfort of your own venv. It's cheaper, too!

A bit of searching lead me to @Chapagain's post which was very useful and got me started - thankyou

I decided that I really want to do something more real-time, and while I could have done more scraping with Beautiful Soup, a quick look at the html that's returned with you run

import requests

url = "https://twitter.com/search?q=%23auspol&src=typed_query&f=live"
result = requests.get(url)
print(result.text)

is eye-wateringly complex. (Go on, try it!) I just couldn't be bothered with that so I signed up for a Twitter developer account and started looking at the APIs available for searching. These are easily used with the Twython library:

from twython import Twython

twitter = Tython(consumer_key, consumer_secret,
                 access_token, access_token_secret)
hashtag = "#auspol"
results = twitter.search(q=hashtag, result_type="recent")
for tweet in results["statuses"]:
    sentiment = classifier_func(tweet["text"])
    print(sentiment.prob("pos"))

I hit the rate limit a few times until I realiased that there was a while true going on inside Twython when using the cursor method. In my print-to-shell proof of concept, I got past that by using the search function inside a while loop with a 30second sleep call. I knew that that wasn't good enough for a web app, and would actually be a road block for doing a properly updated graph-focused page.

For that I would need a charting library, and some JavaScript. I started out using Chart.js, but quickly realised that it didn't have any sort of flow, so then I retooled to use C3js instead.

The initial render of the template provides the first set of data, which is a JavaScript array ([]), and checks for a saved hashtag and the id of the most recently found tweet using Window.sessionStorage(). Then we set up a function to get new data when called:

function getNewData() {
    var xhr = new XMLHttpRequest();
    xhr.open("GET", "/sentiment?hashtag="+hashtag+"&lastid="+lastid, true);
    xhr.onload = function (e) {
        if ((xhr.readyState === 4) && (xhr.status === 200)) {
            parsed = JSON.parse(xhr.responseText);
            sessionStorage.setItem("lastid", parsed["lastid"]);
            lastid = parsed["lastid"];
            labels = parsed["labels"];
            // Did we get new data points?
            if (parsed["chartdata"].length > 1) {
                // yes
                newDataCol = [ parsed["chartdata"] ];
                curidx += parsed["chartdata"].length - 1;
            } else {
                newDataCol = [];
            }
        }
    };
    xhr.onerror = function (e) {
        console.error(xhr.statusText);
    };
    xhr.send(null);
};

Finally, we need to tell the window to call our updateChart() function every 30 seconds, and define that function:

function updateChart() {
    getNewData();
    if (newDataCol !== []) {
        chart.flow({
            columns: prevDataCol,
            done: function () {
               chart.flow({
                   columns: newDataCol,
                   line: { connectNull: true }
               })
            }
        });
        prevDataCol = newDataCol;
    }
};

/* Update the chart every 30 seconds */
window.setInterval(updateChart, 30000);

So that you can change the hashtag to watch, I added a small <form> element which POSTs the new hashtag to the /sentiment method on submit and then re-renders the template.


/images/2019/sentiment1.png


What I'm particularly happy with is that the JavaScript took me only a few hours last Saturday morning and was pretty straightforward to write.

You can find the code for this project in my GitHub repo au-pol-sentiment.


Microservices (part 1)

Since I departed from my comfortable niche in Solaris engineering earlier this year, I've spent a considerable amount of time and energy in re-training and upskilling to assist my employment prospects. Apart from acquainting myself with a lot of terminology, I've written code. A lot of code. Mostly, as it turns out, has been related to microservices.

This post is about a microservice I wrote to assist with accessibility in a specific part of the Australian electoral process (finding out which electorate you live in) and some supporting digressions.

You can find all the code for this microservice and its associated data preparation in my GitHub repos grabbag and find-my-electorate.

On 18 May 2019, Australia had a federal election, and in the lead up to that event I became very interested in political polling. While I have a few ideas on the subject which are on my back burner, mind-mapping the various components of political polling got to wondering how do the various state, territory and federal electoral commissions map a voter's address to an electorate?

My first point of call was the Australian Electoral Commission and their Find my electorate site. This is nicely laid out and lets you find out which electorate you are in - by postcode. This is all well and good if you're in a densely populated area, like the electorate of Brisbane - three suburbs. If, however, you choose somewhere else, like 2620 which covers a lot of Canberra and surrounding districts, you wind up with several electorates covering 2620.

The AEC's website is written in asp.net, which is up to the task, but when you have more than one page of results the authors of the page make use of some (to my mind) squirrelly features and callbacks which make scraping the site difficult. As best I can determine, the AEC doesn't provide an API to access this information, so Another Method was required.

At this point, I turned to the standard libraries for this sort of thing in the Python worldL Beautiful Soup and requests. I started by setting up a quick venv to keep the dependencies contained

$ python3.7 -m venv scraping-venv
$ . scraping/bin/activate
(scraping-venv) $ pip install requests bs4 json csv

Now since we know the url to GET, we can get the first page of responses very easily:

import requests
from bs4 import BeautifulSoup

url =  "https://electorate.aec.gov.au/LocalitySearchResults.aspx?"
url += "filter={0}&filterby=Postcode"

result = requests.post(url.format(2620))
resh = BeautifulSoup(result.text, "html.parser")

Beautiful Soup parses the response text, and gives us a tree-like structure to work with. Making use of the Chrome devtools (or the Firefox devtools ) I could see that I need to find a <table> with an attribute of *ContentPlaceHolderBody_gridViewLocalities* - what a mouthful! - and then process all the table rows (<tr>) within that table

tblAttr = "ContentPlaceHolderBody_gridViewLocalities"
restbl = resh.find_all(name="table", attrs={"id": tblAttr})
rows = restbl[0].find_all("tr")

Using a for loop we can construct a dict of the data that we actually need. Simple!

What do we do, though, when we want to get the second or later pages of result? This is where the squirrelly features and callbacks come in. The page makes use of an __EVENTARGUMENT element which is POST ed as payload back to the same url. The way that we determine this is to look for a row with the class pagingLink, then for each table data (<td>) element check for its contents matching this regex

".*__doPostBack.'(.*?gridViewLocalities)','(Page.[0-9]+)'.*")
/images/2019/paginglinktable.png

And after that we can recursively call our query with the extra payload data in the argument list:

def queryAEC(postcode, extrapage):
    """
    Queries the AEC url and returns soup. If extrapage is empty
    then we pass the soup to findFollowups before returning.
    """
    url = "https://electorate.aec.gov.au/LocalitySearchResults.aspx?"
    url += "filter={0}&filterby=Postcode"

    if not extrapage:
        res = requests.post(url.format(postcode))
    else:
        payload["__EVENTARGUMENT"] = extrapage
        res = requests.post(url.format(postcode), data=payload)

I now had a script to run which extracted this info and pretty-printed it (as well as the same info in JSON):

$ ./postcode.py 2620
State    Postcode   Locality                         Electorate
ACT      2620       BEARD                            Canberra
ACT      2620       BOOTH DISTRICT                   Bean
NSW      2620       BURRA                            Eden-Monaro
NSW      2620       CARWOOLA                         Eden-Monaro
NSW      2620       CLEAR RANGE                      Eden-Monaro
ACT      2620       CORIN DAM                        Bean
NSW      2620       CRESTWOOD                        Eden-Monaro
NSW      2620       ENVIRONA                         Eden-Monaro
NSW      2620       FERNLEIGH PARK                   Eden-Monaro
NSW      2620       GOOGONG                          Eden-Monaro
NSW      2620       GREENLEIGH                       Eden-Monaro
NSW      2620       GUNDAROO                         Eden-Monaro
ACT      2620       HUME                             Bean
NSW      2620       KARABAR                          Eden-Monaro
ACT      2620       KOWEN DISTRICT                   Canberra
ACT      2620       KOWEN FOREST                     Canberra
NSW      2620       MICHELAGO                        Eden-Monaro
ACT      2620       OAKS ESTATE                      Canberra
ACT      2620       PADDYS RIVER DISTRICT            Bean
NSW      2620       QUEANBEYAN                       Eden-Monaro
NSW      2620       YARROW                           Eden-Monaro
NSW      2620       QUEANBEYAN EAST                  Eden-Monaro
NSW      2620       QUEANBEYAN WEST                  Eden-Monaro
NSW      2620       RADCLIFFE                        Eden-Monaro
ACT      2620       RENDEZVOUS CREEK DISTRICT        Bean
ACT      2620       ROYALLA                          Bean
NSW      2620       ROYALLA                          Eden-Monaro
NSW      2620       SUTTON                           Eden-Monaro
ACT      2620       TENNENT DISTRICT                 Bean
ACT      2620       THARWA                           Bean
NSW      2620       THARWA                           Eden-Monaro
NSW      2620       THE ANGLE                        Eden-Monaro
NSW      2620       THE RIDGEWAY                     Eden-Monaro
NSW      2620       TINDERRY                         Eden-Monaro
NSW      2620       TRALEE                           Eden-Monaro
ACT      2620       TUGGERANONG DISTRICT             Bean
NSW      2620       URILA                            Eden-Monaro
NSW      2620       WAMBOIN                          Eden-Monaro
ACT      2620       WILLIAMSDALE                     Bean
NSW      2620       WILLIAMSDALE                     Eden-Monaro

That really is quite a few suburbs.

So now that we've got a way to extract that information, how do we make it available and useful for everybody? With a microservice! I hear you cry.

The very first microservice I wrote (in 2011-12, the subject of a future post) used CherryPy, because we'd embedded it within Solaris IPS (image packaging system) and didn't need any further corporate approvals. The path of least resistance. This time, however, I was unconstrained regarding approvals, so had to choose between Django and flask. For no particular reason, I chose flask.

It was pretty easy to cons up the requisite templates, and write the /results method. It was at this point that my extend the fix habit (learnt via the Kepner-Tregoe Analytical Troubleshooting training many years ago) kicked in, and I started exploring the Electoral Commission of Queensland website for the same sort of information. To my surprise, the relatively straight-forward interface of the AEC was not available, and the closest analogue was an interactive map.

After a brief phone conversation with ECQ and more digging, I discovered that the 2017 boundaries were available from QLD Spatial in shapefile, MapInfo and Google Maps KML formats. This was very useful, because KML can be mucked about with directly using Beautiful Soup. After not too much effort I had the latitude+longitude pairs for the boundaries extracted and stored as JSON . My phone conversation with ECQ also took me down the path of wanting to translate a street address into GeoJSON - and that took me to the Google Maps API. I did investigate OpenStreetMap's api, but testing a few specific locations (addresses where we've lived over the years) gave me significantly different latitude+longitude results. I bit the bullet and got a Google Maps API key .

The next step was to research how to find out if a specific point is located within a polygon, and to my delight the Even-odd rule has example code in Python, which needed only a small change to work with my data arrangement.

With that knowledge in hand, it was time to turn the handle on the Google Maps API :

keyarg = "&key={gmapkey}"
queryurl = "https://maps.googleapis.com/maps/api/geocode/json?address="
queryurl += "{addr} Australia"
queryurl += keyarg

...
# Helper functions
def get_geoJson(addr):
    """
    Queries the Google Maps API for specified address, returns
    a dict of the formatted address, the state/territory name, and
    a float-ified version of the latitude and longitude.
    """
    res = requests.get(queryurl.format(addr=addr, gmapkey=gmapkey))
    dictr = {}
    if res.json()["status"] == "ZERO_RESULTS" or not res.ok:
        dictr["res"] = res
    else:
        rresj = res.json()["results"][0]
        dictr["formatted_address"] = rresj["formatted_address"]
        dictr["latlong"] = rresj["geometry"]["location"]
        for el in rresj["address_components"]:
            if el["types"][0] == "administrative_area_level_1":
                dictr["state"] = el["short_name"]
    return dictr

When you provide an address, we send that to Google which does a best-effort match on the text address then returns GeoJSON for that match. For example, if you enter

42 Wallaby Way, Sydney

the best-effort match will give you

42 Rock Wallaby Way, Blaxland NSW 2774, Australia

I now had a way to translate a street address into a federal electorate, but with incomplete per-State data my app wasn't finished. I managed to get Federal, Queensland, New South Wales, Victoria and Tasmania data fairly easily (see the links below) and South Australia's data came via personal email after an enquiry through their contact page. I didn't get any response to several contact attempts with either Western Australia or the Northern Territory, and the best I could get for the ACT was their electorate to suburb associations.

I remembered that the Australian Bureau of Statistics has a standard called Statistical Geography, and the smallest unit of that is called a Mesh Block:

Mesh Blocks (MBs) are the smallest geographical area defined by the ABS. They are designed as geographic building blocks rather than as areas for the release of statistics themselves. All statistical areas in the ASGS, both ABS and Non ABS Structures, are built up from Mesh Blocks. As a result the design of Mesh Blocks takes into account many factors including administrative boundaries such as Cadastre, Suburbs and Localities and LGAs as well as land uses and dwelling distribution. (emphasis added)

Mesh Blocks are then aggregated into SA1s:

Statistical Areas Level 1 (SA1s) are designed to maximise the spatial detail available for Census data. Most SA1s have a population of between 200 to 800 persons with an average population of approximately 400 persons. This is to optimise the balance between spatial detail and the ability to cross classify Census variables without the resulting counts becoming too small for use. SA1s aim to separate out areas with different geographic characteristics within Suburb and Locality boundaries. In rural areas they often combine related Locality boundaries. SA1s are aggregations of Mesh Blocks. (emphasis added)

With this knowledge, and a handy SA1-to-postcode map in CSV format

$ head australia-whole/SED_2018_AUST.csv
SA1_MAINCODE_2016,SED_CODE_2018,SED_NAME_2018,STATE_CODE_2016,STATE_NAME_2016,AREA_ALBERS_SQKM
10102100701,10031,Goulburn,1,New South Wales,362.8727
10102100702,10053,Monaro,1,New South Wales,229.7459
10102100703,10053,Monaro,1,New South Wales,2.3910
10102100704,10053,Monaro,1,New South Wales,1.2816
10102100705,10053,Monaro,1,New South Wales,1.1978
....

I went looking into the SA1 information from the ABS shapefile covering the whole of the country. Transforming the shapefile into kml is done with ogr2ogr and provides us with an XML schema definition. From the CSV header line above we can see that we want the SA1_MAINCODE_2016 and (for validation) the STATE_NAME_2016 fields. Having made a per-state list of the SA1s, we go back to the kml and process each member of the document:

  <gml:featureMember>
    <ogr:SED_2018_AUST fid="SED_2018_AUST.0">
      <ogr:geometryProperty>
        <gml:Polygon srsName="EPSG:4283">
          <gml:outerBoundaryIs>
            <gml:LinearRing>
              <gml:coordinates>
  ....
              </gml:coordinates>
            </gml:LinearRing>
          </gml:outerBoundaryIs>
        </gml:Polygon>
      </gml:polygonMember>
    </ogr:geometryProperty>
    <ogr:SED_CODE18>30028</ogr:SED_CODE18>
    <ogr:SED_NAME18>Gladstone</ogr:SED_NAME18>
    <ogr:AREASQKM18>2799.9552</ogr:AREASQKM18>
  </ogr:SED_2018_AUST>
</gml:featureMember>

The gml:coordinates are what we really need, they're space-separated lat,long pairs.

for feature in sakml.findAll("gml:featureMember"):
sa1 = feature.find("ogr:SA1_MAIN16").text
mb_coord[sa1] = mb_to_points(feature)

for block in mb_to_sed:
    electorate = mb_to_sed[block]
    sed_to_mb[electorate]["coords"].extend(mb_coord[block])

After which we can write each jurisdiction's dict of localities and lat/long coordinates out as JSON using json.dump(localitydict, outfile).

To confirm that I had the correct data, I wrote another simple quick-n-dirty script jsoncheck.py to diff the SA1-acquired JSON against my other extractions. There was one difference of importance found - Queensland has a new electorate McConnel, which was created after the most recent ABS SA1 allocation.

So that's the data preparation done, back to the flask app! The app listens at the root (/), and is a simple text form. Hitting enter after typing in an address routes the POST request to the results function where we call out to the Google Maps API, load the relevant state JSONified electorate list, and then locate the Federal division. There are 151 Federal divisions, so it's not necessarily a bad thing to search through each on an alphabetic basis and break when we get a match. I haven't figured out a way to (time and space)-efficiently hash the coordinates vs divisions. After determining the Federal division we then use the same method to check against the identified state's electorate list.

The first version of the app just returned the two electorate names, but I didn't think that was very friendly, so I added another call to the Google Maps API to retrieve a 400x400 image showing the supplied address on the map; clicking on that map takes you to the larger Google-hosted map. I also added links to the Wikipedia entries for the Federal and state electorates. To render the image's binary data we use b64encode:

from base64 import b64encode

keyarg = "&key={gmapkey}"
imgurl = "https://maps.googleapis.com/maps/api/staticmap?size=400x400"
imgurl += "&center={lati},{longi}&scale=1&maptype=roadmap&zoom=13"
imgurl += "&markers=X|{lati},{longi}"
imgurl += keyarg

# Let's provide a Google Maps static picture of the location
# Adapted from
# https://stackoverflow.com/questions/25140826/generate-image-embed-in-flask-with-a-data-uri/25141268#25141268
#
def get_image(latlong):
    """
    latlong -- a dict of the x and y coodinates of the location
    Returns a base64-encoded image
    """
    turl = imgurl.format(longi=latlong["lng"],
                         lati=latlong["lat"],
                         gmapkey=gmapkey)
    res = requests.get(turl)
    return b64encode(res.content)


....

# and in the results function
    img_data = get_image(dictr["latlong"])

    return render_template("results.html",
                           ...,
                           img_data=format(quote(img_data))
                           ...)

Putting that all together gives us a rendered page that looks like this:

/images/2019/resultspage.png

To finalise the project, I ran it through flake8 again (I do this every few saves), and then git commit followed by git push.


Reference data locations


Jurisdiction

URL

Federal

aec.gov.au/Electorates/gis/gis_datadownload.htm

Queensland

qldspatial.information.qld.gov.au/catalogue/custom/detail.page?fid={079E7EF8-30C5-4C1D-9ABF-3D196713694F}

New South Wales

elections.nsw.gov.au/Elections/How-voting-works/Electoral-boundaries

Victoria

ebc.vic.gov.au/ElectoralBoundaries/FinalElectoralBoundariesDownload.html

Tasmania

www.tec.tas.gov.au/House_of_Assembly_Elections/index.html


Tasmania's state parliament has multi-member electorates, which have the same boundaries as their 5 Federal divisions.

South Australia data was provided via direct personal email.

Australian Capital Territory, Western Australia and Northern Territory data was extracted from the ABS shapefile after ogr2ogr-converting from MapInfo Interchange Format.


A response to some reading materials

As part of my effort to get up to date with my skillset, I've joined the dev.to community (pointed out by Ali Spittel, who has written some very good pieces on medium.com). This morning I came across a piece from last year which I thought would be worth a read: 9 Software Architecture Interview Questions and Answers.

It started out fairly well:

A software architect is a software expert who makes high-level design choices and dictates technical standards, including software coding standards, tools, and platforms. Software architecture refers to the high level structures of a software system, the discipline of creating such structures, and the documentation of these structures.

I don't believe that the rest of the piece matches up to that initial paragraph. The first question was pretty good: What does "program to interfaces, not implementations" mean? The sting, though, was that theanswer dived straight into OO-speak, talking about factories.

I'm sure that's ok for somebody who has just finished their first single-semester class on Design Patterns, but doesn't help you in the real world - and surely your lecturer for that class would be keen to help you turn the theory into practice?

Cue #TheVoiceOfExperience!

When I was working as a tier-4 support engineer for Sun Microsystems, we had a support call from an (of course) irate customer when a recent kernel/libc patch had fixed a bug. I forget the details of the bug, but I do not forget what the customer insisted that we do. They demanded that we reverse the bugfix because their product depended upon the broken behaviour.

Many other customers, along with our test teams and engineering teams, had identified that this particular behaviour was a bug and needed to be fixed. Fixed so that our product behaved according to a particular published specification. Everybody apart from this irate customer wanted us to get the interface correct.

If I get asked a question along these lines, I answer that you cannot depend upon the implementation of any interface, because that's not sustainable for reliable software. If you depend upon particular behaviour from an implementation, then you are at the mercy of the implementor and that way lies increased costs. Don't do it. Or if you absolutely must (yes, there are times when that's the case), then do your utmost to ensure that you get a commitment from the implementation provider that they won't go and change things out from under you without warning. In the Solaris development model, this was a Contract and where we had them we adhered to them - rigorously.

The second question wasn't about Software Architecture at all:

Q2: What are the differences between continuous integration, continuous delivery, and continuous deployment?

The subhead even called that out as #DevOps!

This question is about engineering processes. If you want to turn it into a question which is closer to being about architecture, perhaps you could ask

Please describe your software development quality framework, and how you put it into practice.

Questions three, four and five were all about whether you could recall what certain acronyms stood for (SOLID, BASE and CAP); so, a bit architecture-y. I suggest, however, that the question about SOLID is actually a theoretical computer science issue rather than architecture - at least, architecture as I understand it. It's definitely useful to know and understand SOLID, but unless I'm interviewing for a computer science research position, I bet that you're interested in how I put that knowledge into practice in designing the best architecture for the application at hand.

Question six was back to architecture of sorts, but when you unpack the "Twelve Factor App Methodology" it's implementation (best practices) rather than architecture, and that makes the whole topic one of software engineering rather than architecture.

Yes, there's a difference.

Yes, it matters. (Also, yes, I'll ramble on about this in other posts - later).

Question seven was actual architecture:

Q7: What are Heuristic Exceptions?

This is a very good question, because it asks you to think about how to handle failure in the absence of a controller which tells your sub-process what to do. This is an area of clustered operation implementations which gets a lot of attention. In the clusterware environments that I've worked on, these clusters ran telco switches, billing systems, bank credit card transaction processors and even emergency service dispatch systems. You must get the response and system architecture correct because otherwise people could die.

/images/suncluster-rocks.jpg

The final two questions are also pretty good for architecture topics:

Q8: What is shared-nothing architecture? How does it scale? Q9: What does Eventually Consistent mean?

I first came across the shared-nothing architecture while reading a Sun Cluster docbook relating to the IBM Informix agent. At that time (circa 2001) the architecture appeared to be rare when used in the context of Sun Cluster or Veritas cluster. Now, however, it's pretty much the basis for any microservice you might want to spin up with Kubernetes or Docker.

Over the course of 2018 I interviewed 36 candidates for positions in the team I was working with inside Oracle. I asked questions relating to software engineering practice, to personal preferences (vi, emacs or VS code? Do you login as root or as your own user? were just two), knowledge of the standard C library, and just two that related in any way to architecture. For the record, those questions were

Is it better for your code to be correct or to be fast?

followup: can you think of a use-case for the other answer?

and

When you're designing a utility or application which requires the user provide a password, is it acceptable to provide the password as a command-line argument? What risks are there in doing so?

My gripe with this post on dev.to is that it's not just about software architecture, it's also about computer science and software engineering (not a bad thing at all) but most importantly, of the questions presented, the proposed answers for four of them depend more on whether you can regurgitate definitions from a textbook, rather than explain how the theory is usedin practice. If you're going for a position as a computer science academic then, sure, regurgitate the textbook definition. But otherwise, I want to know how you can put SOLID into practice.


Project Lullaby - part 1

My time at Oracle has come to a close, so I'm going to take this opportunity to ramble a bit about some of the things I've worked on, and one project in particular which I'm particularly proud of.

#begin(ramble)

I started using SunOS when I started university. The university had Sun servers, and both the CS, Maths and Electrical Engineering departments had workstations as well. It was my first hands-on exposure to a UNIX of any sort; my knowledge previously was based on articles from Byte and Dr Dobb's Journal. I spent many hours in the CS labs poking around and exploring. Sometimes I even did my assignments! Over the first summer break the faculty computer unit upgraded every system to Solaris 1 and as you might expect, printing was totally different. We wailed a lot. And got on with figuring out how to use the SysV environment.

When I started work in the university library, there was a SparcStation 5 running Solaris 2.5, and a rather early version of NCSA and then Apache httpd. On moving to another university as a fulltime system administrator I now had SparcServer1000Ds to manage, along with an early fibrechannel array, backups, and disaster recovery. I learnt a lot and when Sun was next hiring support engineers they asked me in for an interview. I was delighted to receive an offer, and .... now it's close to 20 years later and let me count the roles I've had:

  • front line and back line technical support

  • fourth level technical support, working escalations and fixing bugs

  • working in the Solaris MultiPathed IO (MPxIO) stack for Fibre Channel

  • working in the project team to bring MPxIO to the x86/x64 platform

  • rewriting the Solaris firmware flash (fwflash) utility to make it modular and support any device which has flashable firmware

  • Gatekeeper for the OS/Networking consolidation

  • ISV/IHV liaison for driver development

  • Project Architect and Lead for Project Lullaby

  • worked on userspace and filtering support for the Solaris Analytics project

#end(ramble)

#begin(Scratching an itch)

When I started as Gatekeeper for the OS/Networking (ON hearafter) consolidation, the utility we used to build the gate was called nightly. It was run every night, and took all night long to run. A monolithic shell script, it was uninterruptible and (much more importantly) un-restartable. As my colleague Tim noted, it used almost every letter of the alphabet as a command line option - along with a shell script configuration file.

It had to go.


A Silly Bit Of JavaScript

After many years actively avoiding the issue, I've now accepted the inevitable: I have to learn JavaScript (and node.js too, for that matter). While I've spent many years doing enterprise software development at the boundary of kernel and userspace using C and Python, the software stack above has just been what I consumed rather than created. It's time for that to change.

As it so happens, I'm on gardening leave until COB on the 1st of May. I thought my homepage could do with an update and decided to write a function to display how much time remains:

let secPerDay = 86400;
let enddate = new Date("2019-05-01T07:00:00.000Z");

function timeRemaining() {
    // refers to enddate, which is Date("2019-05-01T07:00:00.000Z")
    let now = new Date();
    if (now >= enddate) {
        return ("Gardening leave has finished, I'm a free agent");
    };
    let diff = (enddate.getTime() - now.getTime())/1000/secPerDay;
    let days = Math.floor(diff);
    let frachours = 24 * (diff - days);
    let hours = Math.floor(frachours);
    let minutes = Math.floor(60 * (frachours - hours));
    return ("Gardening leave ends in " + days + " days, " + hours + " hours, " + minutes + " minutes.");
}

function outputTR() {
    let el = document.getElementById("TextDiv");
    el.innerHTML = "<b>" + timeRemaining() + "</b>";
    el.color = "#000000";
};

window.setInterval("outputTR()", 1000);

Pretty simple, a little bit silly, but does the job. I'm actually excited by it because it's an opportunity for me to rejig my thinking about what my "kernel" is - it's the browser.

As it happens I also picked up a book called Data Visualization: A Practical Introduction so I can see a fair bit of inquiry into government datasets in my future.